What Does Peak Charging Power Mean?
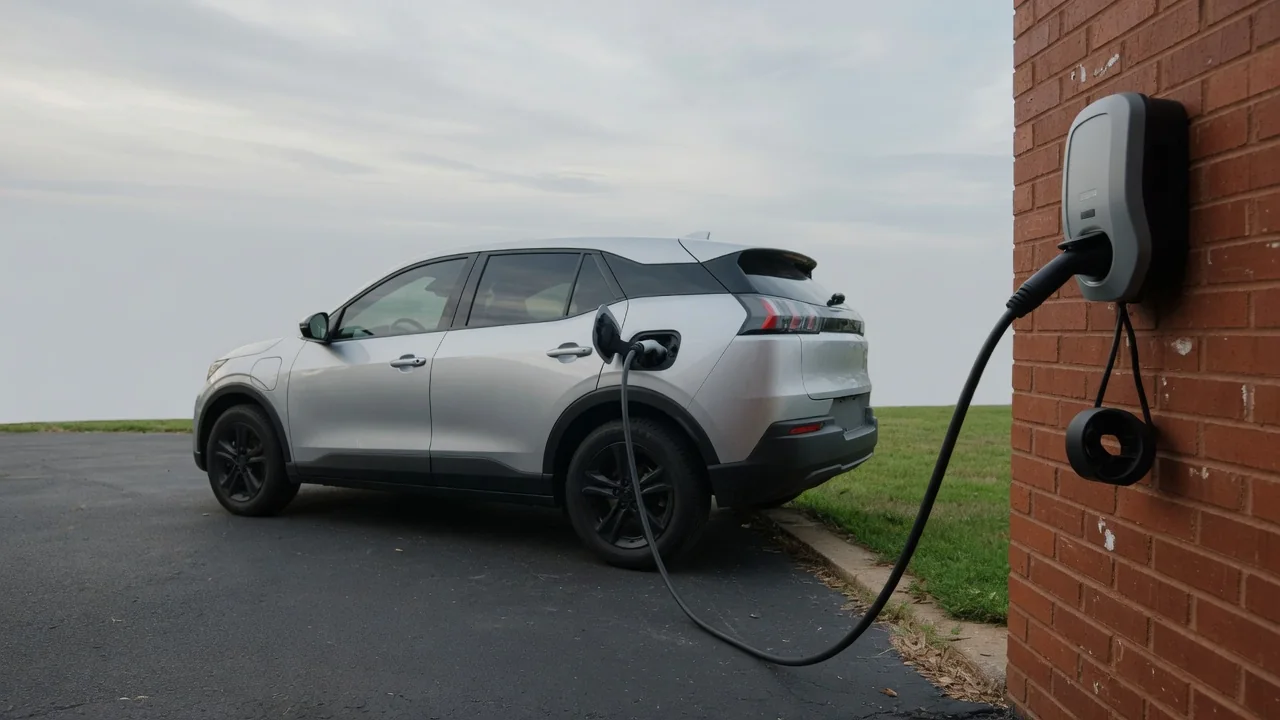
Anyone comparing electric vehicles eventually asks: what does peak charging power mean? It is the highest rate, measured in kilowatts, at which a battery can accept energy at any single moment during a DC fast charging session. That figure is a ceiling the car touches briefly, not the pace it holds from start to finish, and the difference shapes how long a stop really takes.
Power curve
A charging session is best pictured as a curve plotting kilowatts against the battery's state of charge. Power usually climbs quickly after plug-in, reaches its highest point somewhere in the lower part of the pack's range, and then steps or slopes downward as the cells fill. Peak charging power is simply the tallest point on that line. The average, by contrast, is the total energy delivered divided by the time connected, which is always lower than the peak.
Curve shapes differ widely between vehicles. Some packs spike to a high number for only a few minutes and then fall away steeply, while others hold a more modest plateau across a wide band of charge. A hypothetical car that briefly touches 250 kilowatts but averages 120 from a low to a high state of charge may add range no faster than one that never exceeds 180 yet sustains it longer. The published curve for a specific model, where the manufacturer provides one, tells more than the headline figure.
Conditions
Reaching the advertised peak depends on several conditions lining up at once. The battery must be at a low state of charge, because cell voltage rises as the pack fills and the battery management system reduces current to protect the cells. Pack temperature matters just as much: cold cells accept charge slowly, and a very hot pack may also be limited. Many vehicles can precondition the battery on the way to a fast charger, though how that function is triggered varies by make.
The charging station sets its own ceiling. A dispenser rated below the car's capability caps the session at the station's output, and sites that share power between stalls may deliver less when neighboring bays are occupied. Pack voltage architecture also plays a part, since a charger's current limit translates into different power on lower-voltage and higher-voltage systems. Cable temperature, station faults and grid constraints can each reduce delivery, so an identical car may show different peaks at two locations on the same day.
Trip planning
On a road trip, the average rate across the portion of the battery actually used determines stop length. Because power is strongest at low states of charge, arriving with a small buffer and leaving once the taper becomes pronounced usually yields the most miles per minute. Two shorter stops in the fast part of the curve often cost less total time than one long session pushed toward full, where the final portion can crawl at a fraction of the earlier rate.
Route planners built into many vehicles and third-party apps model this behavior, estimating arrival charge and suggesting when to unplug. Their predictions depend on speed, weather, elevation and load, so real results drift from the estimate. Efficiency matters alongside charging speed as well: a vehicle that uses less energy per mile gains more range from each kilowatt-hour, so a lower peak figure does not automatically mean slower travel. Comparing time to add a given distance is more revealing than comparing peak kilowatts alone.
Everyday Use and Observations
Most daily charging happens on AC power at home or work, where the peak figure for DC fast charging is irrelevant. There the onboard charger and the circuit supplying it set the rate, and power stays nearly flat for most of the session because it sits far below what the battery could accept. Drivers who rarely leave town may never see their car's maximum fast charging rate, which makes it a poor basis for choosing a vehicle used mainly for commuting.
At a fast charger, the vehicle's display or the station screen typically shows live power in kilowatts along with the current state of charge. Watching those numbers reveals the curve in action: a strong start, a peak that may last only moments, then a gradual decline. Some cars also report energy added and elapsed time, which makes it possible to work out the session average. Seeing a lower number than expected is common and usually reflects temperature, charge level or station limits rather than a defect.
Limits and Next Steps
Peak charging power is a useful comparison point, but it describes capability under favorable conditions, not a guarantee. Manufacturers measure and present it differently, software updates can reshape a curve, and battery aging may gradually alter how much power a pack accepts. A persistent, marked shortfall across several stations and in mild weather with a warm, low battery is worth noting. Even then, any warning message or stored fault code is evidence to interpret, not proof that a particular component has failed.
A sensible next step is to look up the vehicle-specific charging information in the owner's manual or from the manufacturer, including recommended preconditioning practices and any guidance on charge limits for battery longevity. Noting charger rating, starting charge, outside temperature and observed power over a few sessions builds a clear picture of normal behavior. If results stay well below expectations, a dealer or qualified EV technician can check battery health and thermal system operation, since high-voltage components are not suitable for home diagnosis.