Why Do Scan Tools Show Live Data? Reading Sensor Values in Context
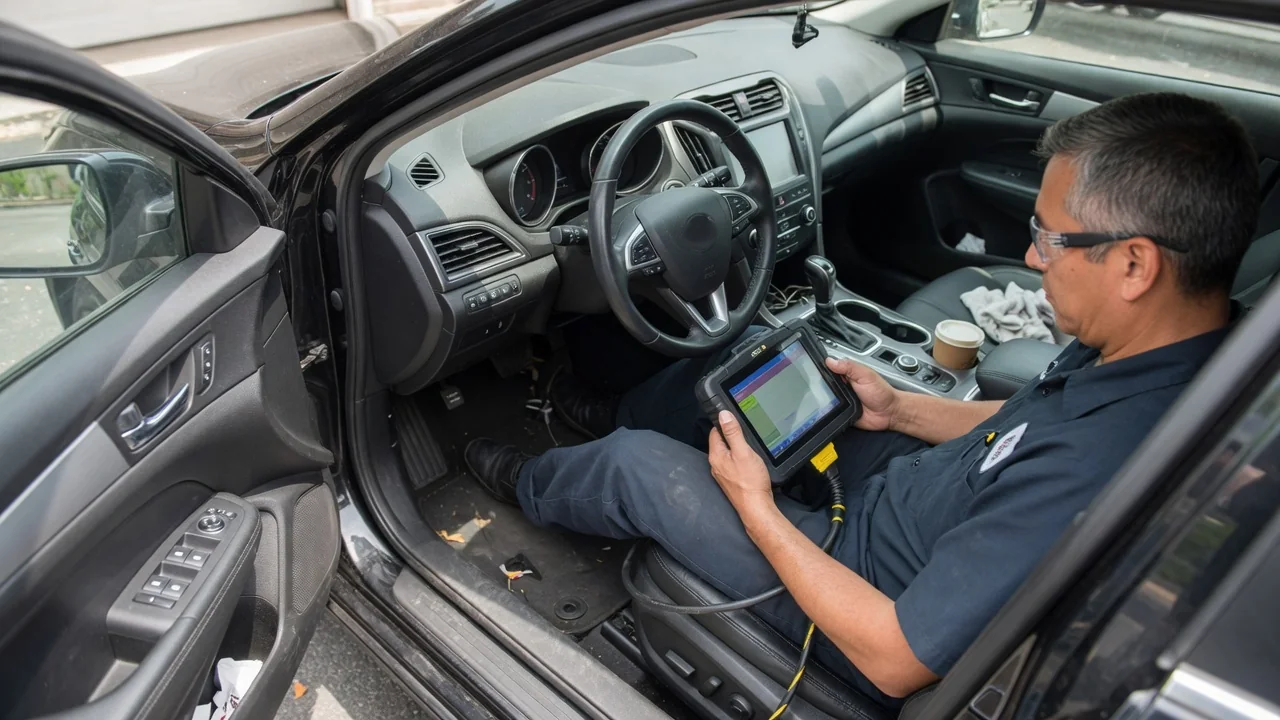
A trouble code tells you that the engine computer noticed something outside its expected range, but it rarely explains why. That is the main reason scan tools show live data. The stream of current sensor values and calculated figures lets you watch what the control module sees while the vehicle runs. Car live data, the conditions under which it is captured, and the way each sensor is used turn a scan tool from a code reader into a genuine diagnostic aid.
Current readings
Live data is the scan tool's view of what the powertrain control module is reading and calculating at this moment. The module constantly monitors inputs such as coolant temperature, intake air temperature, throttle position, airflow or manifold pressure, crankshaft speed, and oxygen sensor signals. It uses them to control fuel delivery, ignition timing, and other outputs. On OBD-II vehicles, a standardized set of these values, called parameter IDs or PIDs, can be requested through the diagnostic connector. Each value reflects what the module believes, which is usually, but not always, what is physically happening.
Not every value on the screen comes straight from a sensor. Some parameters are raw signals, such as an oxygen sensor voltage. Others are sensor inputs converted into familiar units, such as degrees or pressure. Many are calculated by the module, including engine load and fuel trim. Some are commands or status flags, such as fuel system loop status or cooling fan requests. Beyond the generic list, many manufacturers expose additional enhanced data that only compatible tools can read, and the selection varies widely by make, model, and tool.
The values also arrive in sequence rather than all at once. The scan tool polls the module over the vehicle's communication network, so the more parameters you display, the less often each one updates. A brief dropout or spike can fall between samples and never appear on screen. Narrowing the list to the few parameters relevant to the problem, and viewing them as a graph rather than as numbers, makes fast changes much easier to see.
Conditions
A sensor reading has little meaning without knowing the conditions that produced it. Engine temperature, rpm, load, vehicle speed, and outside temperature all change what normal looks like. During a cold start, for example, most engines run in open loop. In this mode the module relies on preset fuel calculations and largely ignores oxygen sensor feedback. Once the engine warms and the sensors are ready, the system typically switches to closed loop and begins correcting the mixture continuously. A value that is expected in one state can indicate a fault in the other.
This is why diagnosis usually involves checking data under several deliberate conditions. Consider a vehicle that has sat long enough to cool fully. With the key on and the engine off, its coolant and intake air temperature readings should generally be close to each other and to ambient temperature. Idle shows baseline behavior with little airflow. Steady cruising, gentle acceleration, and a quick throttle snap each load the engine differently. They can reveal problems such as an airflow sensor that reads accurately at idle but falls short at higher demand.
Freeze frame data adds another layer of context. When many emissions-related trouble codes set, the module stores a snapshot of selected parameters at that moment, often including rpm, load, coolant temperature, speed, and fuel trim. Comparing the freeze frame with live data helps you recreate the situation in which the fault appeared. Otherwise you may test at idle in the driveway and wonder why everything looks fine. Freeze frame contents vary by vehicle and tool.
Interpretation
Interpreting live data starts with asking whether each value is plausible. Does engine speed on the scan tool match the tachometer? Does throttle position rise smoothly when the pedal is pressed and return to the same closed value when it is released? Implausibly extreme readings, or values that jump to a fixed number, often point to an open or shorted circuit rather than to actual conditions. For specific ranges, the service information for the exact vehicle is the reliable reference, because acceptable values differ between engines and control strategies.
The most useful insights usually come from relationships between parameters rather than any single number, and fuel trim is a good example. Short-term trim reacts quickly to oxygen sensor feedback, while long-term trim reflects corrections the module has learned over time. Positive trim means the module is adding fuel because it sees a lean condition, and negative trim means it is removing fuel. Watching how trims change between idle and higher rpm can help separate possibilities. A correction that is large at idle and shrinks under load is often associated with an unmetered air leak. A correction that grows with airflow can suggest a measurement or fuel delivery issue. These are patterns to investigate, not conclusions.
An odd value from a sensor does not automatically mean the sensor is bad. The reading may be accurate and the problem elsewhere. For example, an oxygen sensor may be correctly reporting lean exhaust caused by a leak or a weak fuel supply. Wiring, connectors, grounds, and reference voltage can also distort a signal before it reaches the module. Live data shows where the module's picture of the engine diverges from expectations, which makes it the starting point for finding out why.
Practical implications and limits
In practice, live data is most valuable for narrowing the search before hands-on testing. It can show whether a code reflects a persistent condition or an intermittent one. It can show whether a repair actually changed the module's corrections. It can also point to the circuit or system that deserves a closer look with a multimeter, oscilloscope, smoke test, or pressure gauge. After a repair, it can confirm that readings have returned to a normal pattern.
Live data does have limits. Generic OBD-II parameters cover only part of what the module knows. On many vehicles, useful values such as actual fuel pressure may require enhanced data or a mechanical gauge. When a module detects a failed sensor, it may substitute a default value, so the displayed number can look reasonable while the real signal is missing. Calculated parameters depend on other inputs and can be misleading if those inputs are wrong. Inexpensive tools may update slowly, label parameters inconsistently, or omit graphing, which makes intermittent faults hard to catch.
A few habits make the information more dependable. Recording a baseline while the vehicle is running well gives you a personal reference for later comparison. Saving or graphing a recording during a test drive preserves events that are easy to miss in real time. Most importantly, the driver should keep attention on the road. Have a passenger watch the screen or use the tool's recording function, and review the data once the vehicle is safely parked.