What Is an EV Charging Curve? Power, Temperature, and Trip Planning
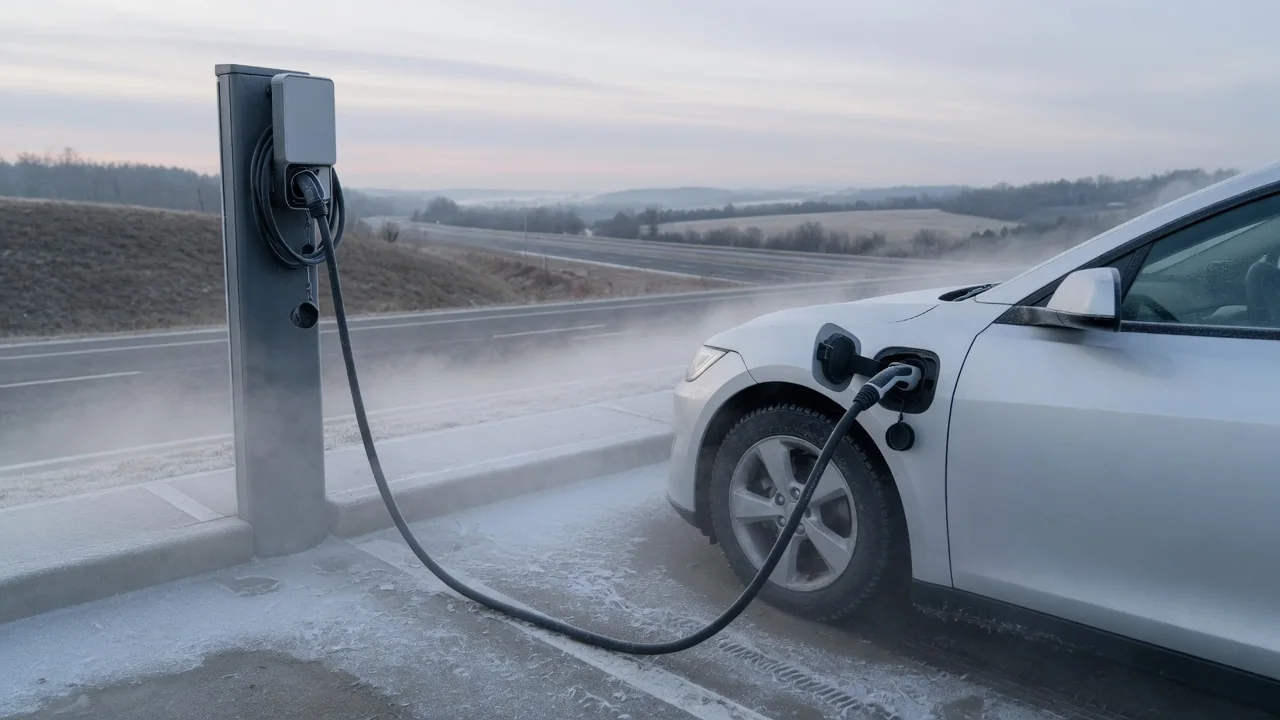
An EV charging curve is the profile of charging power a vehicle accepts during a session, usually plotted against the battery's state of charge. It explains why a fast charger rarely delivers its full rated output for long, why sessions slow as the battery fills, and why the same car can charge differently on a cold morning than on a warm afternoon. Understanding the curve helps drivers estimate stop times and plan longer trips realistically.
Power over state of charge
In its most common form, a charging curve places state of charge, expressed as a percentage, on the horizontal axis and charging power in kilowatts on the vertical axis. Power is the product of voltage and current. During DC fast charging, the vehicle's battery management system decides how much current the battery can safely take at each moment and requests it from the charger. The charger supplies current up to its own hardware limit, so the power you actually see is set by whichever side is more restrictive at that moment.
The curve usually tapers as the battery fills because of how lithium-ion cells behave. As charge accumulates, cell voltage rises toward its maximum allowed value. Pushing high current into a nearly full cell increases heat and raises the risk of lithium plating, where lithium deposits on the anode surface instead of entering it, which can reduce capacity and affect safety. To prevent this, the battery management system steadily reduces current. Conceptually this resembles the constant-current, constant-voltage method used for many lithium-ion batteries, although real EV curves often reduce power in steps or along a gradual slope rather than in two clean phases.
The overall shape differs from one vehicle to another. Some EVs hold a relatively flat plateau through a wide middle range before dropping, some peak early and decline steadily, and others step down in stages. Battery chemistry, cell design, pack voltage architecture, cooling capacity, and the manufacturer's software strategy all influence the result, and software updates can change it. For this reason, an EV charge curve explanation that focuses only on the peak figure misses the point: the peak is a single moment, while the average power across the range you actually use determines how long a stop takes.
Temperature
Lithium-ion cells accept charge most readily within a moderate temperature window. When the battery is cold, internal resistance rises and the chemical processes inside the cell slow down, which makes lithium plating more likely at high charging currents. The battery management system responds by limiting current, sometimes substantially. A battery that has been cold-soaked overnight or after a short drive in winter may charge far below its usual rate at first, then gradually speed up as the pack warms, either from the charging process itself or from a dedicated battery heater.
Excess heat is also limited. Fast charging generates heat in the cells, busbars, and connectors, and the vehicle's thermal management system has finite cooling capacity. If the pack is already warm, for example after sustained highway driving in hot weather or back-to-back fast-charging sessions, the system may reduce power to protect the cells. Charging equipment can likewise reduce output when its own components or cable run hot.
Many EVs offer battery preconditioning, which warms or cools the pack toward a favorable temperature before a fast-charging stop. On some vehicles this starts automatically when a fast charger is set as a navigation destination; on others it is a manual setting or is not available. Because this feature varies widely by vehicle, the owner's manual is the reliable reference for how it works on a given car.
Trip planning
Because charging power is typically highest at lower and middle states of charge, the fastest way to cover a long distance is often to arrive at a charger with a low but comfortable reserve and leave before the curve tapers sharply. Several shorter stops in the high-power portion of the curve can add more range per minute than one long stop that continues deep into the slow upper range. The best departure point depends on the shape of your car's curve and the distance to the next reliable charger, so it is a balance rather than a fixed rule.
A charger's rating is a ceiling, not a promise. A station rated well above what your vehicle can accept will not raise the curve, while a lower-rated unit may cap the plateau and flatten the early part of the session. Some sites also share power between dispensers, so output can drop when another vehicle connects. Built-in navigation systems and third-party route planners model these factors when estimating stop times, but their figures remain approximations based on typical conditions.
For planning purposes, it helps to think in terms of energy or range added over a specific window, such as from a low reserve to a moderate level, rather than the maximum kilowatt figure. It is also wise to keep enough margin to reach an alternative station in case a charger is out of service, occupied, or delivering less power than expected.
Practical implications and limits
A published or shared charging curve reflects the conditions under which it was recorded: battery temperature, starting state of charge, the charger used, software version, and the age of the pack. Your own sessions can look noticeably different. Battery aging tends to raise internal resistance, which may alter the curve over the life of the vehicle. The displayed state of charge is itself an estimate calculated by the battery management system, and many vehicles keep hidden buffers at the top and bottom of the usable range. Treat any curve as a guide to behavior, not a guarantee of a particular charging time.
The curve matters mainly for DC fast charging. With Level 2 AC charging at home or work, the vehicle's onboard charger usually limits power to a level well below what the battery could accept, so power stays fairly steady for most of the session and slows only near the top. Everyday overnight charging is therefore rarely affected in a way drivers notice. Many manufacturers recommend setting a charge limit below full for routine use and charging to full mainly before longer trips; the owner's manual gives the guidance that applies to a specific vehicle.
The most useful habit is simple observation. Watching the in-car charging power display during a few fast-charging stops shows where your vehicle tends to slow down and how strongly temperature affects it in your climate. Combined with the manufacturer's recommendations on fast-charging frequency and charge limits, that knowledge turns the charging curve from an abstract graph into a practical tool for deciding when to stop, how long to stay, and when to move on.