What Is a Racing Data Logger? Sensors, Lap Data and Analysis Explained
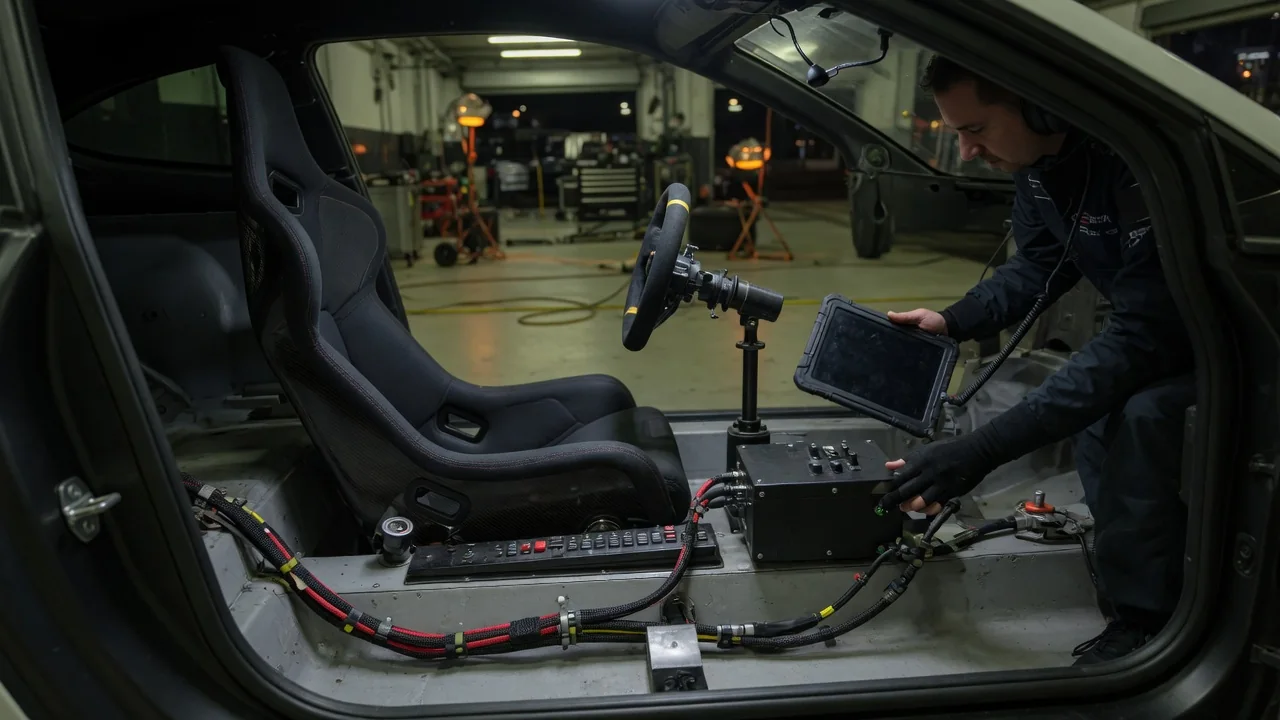
A racing data logger is an onboard device that records measurements from a car's sensors many times per second while it is driven on track. Instead of relying only on a stopwatch and the driver's memory, a motorsport data logger turns every lap into a detailed record of speed, position, driver inputs and vehicle behavior. This guide explains where that information comes from, how the logger organizes it into laps, and how it is analyzed to improve consistency and performance.
Sensors
The logger itself is a recording unit with signal inputs, memory, a power supply and an internal clock that time-stamps every measurement. Each stream of measurements is called a channel, and each channel can be sampled at its own rate. Fast-changing signals such as suspension movement or brake pressure are usually sampled more often than slow-changing ones such as coolant temperature, because a low sample rate can miss short events entirely. Many entry-level loggers contain only two built-in sensors: a GPS receiver for position and speed, and an accelerometer that measures cornering, braking and acceleration forces. Even this minimal combination is enough to draw a track map, record speed and calculate lap times.
More complete systems add external sensors in two broad groups. Driver input sensors measure what the driver is doing: throttle position, brake pressure, steering angle and selected gear. Vehicle sensors measure how the car responds: wheel speeds, engine speed, oil and coolant temperatures, fluid pressures, suspension travel from linear position sensors, and sometimes tire surface temperatures from infrared sensors. On many modern vehicles the engine control unit already shares data over a CAN bus network, so a compatible logger may read some channels without separate sensors. Which channels are available that way depends on the specific vehicle and on whether its data protocol is accessible.
Sensors deliver their information in different forms, such as an analog voltage, a pulse frequency from a toothed wheel, or a digital message. The logger converts these raw signals into engineering units like degrees, bar or miles per hour through calibration. Calibration and installation matter as much as the hardware: a throttle sensor with the wrong zero point or an accelerometer mounted at an angle will produce data that looks plausible but is misleading.
Lap data
Raw channels become lap data once the logger knows where each lap starts and ends. Traditionally this is done with a trackside infrared beacon that the car passes on every lap; many current loggers instead use a virtual start/finish line defined by GPS coordinates. The same method can split each lap into sectors. From these markers the system produces lap times, sector times and often a theoretical best lap, which adds together the driver's best individual sectors from a session to show what a combined lap could have achieved.
Inside each lap, every channel is stored against time, but laps are usually compared against distance. Two laps of different lengths in time cannot be lined up point by point, while distance traveled from the start line places the same corner at the same position on both traces. Distance is calculated from wheel speed, GPS or a blend of the two. Because wheel speed is affected by tire slip and tire diameter, analysis software commonly stretches or compresses each lap slightly so that all laps share the same reference length.
Logging software also creates math channels, which are values calculated from recorded data rather than measured directly. Common examples include combined lateral and longitudinal acceleration, minimum corner speed, braking distance and a running time difference between two laps. The logger cannot record context on its own, so details such as track conditions, tire choice, fuel load and setup changes need to be added as session notes if they are to be useful later.
Analysis
The most widely used analysis method is the overlay: two laps plotted on the same distance axis so their traces can be compared directly. The speed trace shows where one lap is faster, and the time difference channel shows where time is gained or lost and whether it is recovered later. A small loss at a corner entry that grows along the following straight usually points to a slower exit, which matters more than the corner itself because the deficit is carried for the full length of the straight.
For driver development, analysis focuses on inputs. Brake pressure traces reveal the braking point, how quickly peak pressure is reached and how smoothly the brake is released into the corner. Throttle traces show when and how decisively the driver returns to power. Steering traces highlight corrections that suggest the car is unsettled. A plot of lateral against longitudinal acceleration, often called a g-g diagram, shows how fully the available grip is being used when braking and cornering overlap. A track map colored by speed or by time difference makes these patterns easy to locate.
Engineers use the same data to understand the car. Suspension histograms show how often dampers move at various speeds, comparing steering angle with lateral acceleration and speed can indicate understeer or oversteer, and temperature trends across a stint show whether components are overheating. Logging also supports reliability monitoring, for example by revealing an oil pressure dip during long corners. The most useful approach is to change one variable at a time and compare comparable laps, so that any difference can be linked to its cause.
Practical implications and limits
For most users, the right setup depends on the question being asked. A GPS-and-accelerometer unit can show lines, speeds and lap-to-lap consistency, but it cannot explain whether a slow corner came from late braking, a hesitant throttle or a handling problem; answering that requires driver input channels. Adding sensors increases installation effort and analysis time, so it pays to start with a small set of channels that will actually be reviewed. Synchronized onboard video, offered by many systems, helps connect a trace to what the driver saw.
Data records what happened, not why it happened. Traffic, changing grip, tire wear, wind and fuel load can all distort a comparison, so the fairest overlays use laps from similar conditions. Consumer-grade GPS has limited positional accuracy, which makes small differences in racing line hard to judge reliably. A failing sensor or loose connector can create false readings, so obviously implausible values should be checked before conclusions are drawn. Some racing series restrict which channels may be logged, and wiring sensors into a road car's electrical system should follow that vehicle's service information.
Finally, a data logger is a review tool rather than something to study while driving. Its value comes after the session, when traces are examined calmly and turned into one or two specific goals for the next run. Used that way, it complements coaching and driver feel instead of replacing them, and it gives a clear, repeatable record of progress over time.