How to Track a Car's Fuel Use Over Time
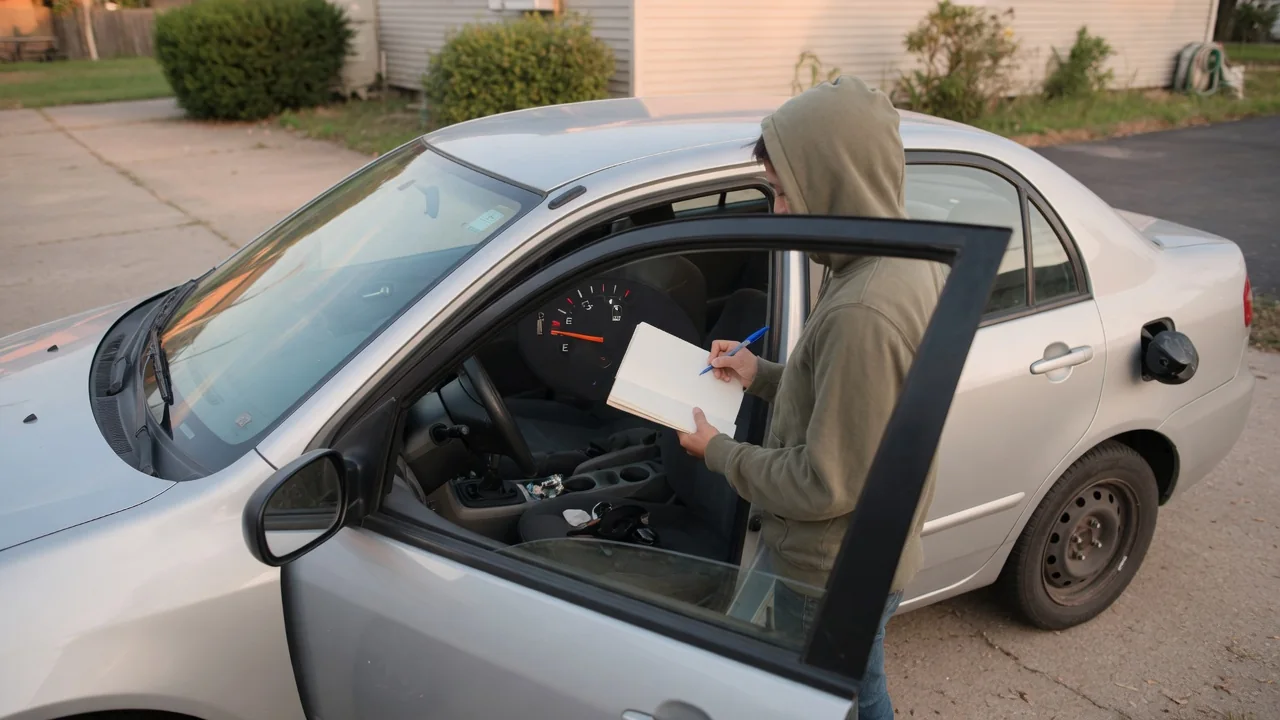
Learning how to track a car's fuel use over time takes little more than a notebook, a pen, and a steady habit at the pump. A simple fill-up log turns scattered receipts into a clear picture of fuel economy, showing how the vehicle behaves across seasons, routes, and driving styles, and giving early notice when consumption drifts away from its usual pattern.
Record distance and fuel
Each entry starts at the pump. Fill the tank until the nozzle clicks off on its own, then write down the date, the odometer reading, and the gallons shown on the pump display. At the next fill-up, do the same. Subtracting the earlier odometer reading from the new one gives the miles driven, and dividing that distance by the gallons just added gives miles per gallon for that tank. As an illustration, 300 miles on 10 gallons works out to 30 miles per gallon.
Consistency matters more than precision. Stopping at the first automatic click every time keeps the fill level comparable from one entry to the next, while squeezing in extra fuel adds guesswork. A partial fill still belongs in the log, but mark it so its gallons can be combined with the next full tank before doing the math. Resetting a trip meter at each fill offers a handy cross-check on the odometer subtraction. Plug-in hybrids need an extra note, because some of their miles come from electricity rather than gasoline.
Compare similar conditions
A tank burned on steady interstate cruising and a tank spent in stop-and-go commuting are not measuring the same thing, so comparing them directly can suggest a problem that does not exist. Cold weather usually lowers fuel economy as well, since engines take longer to warm up, winter fuel blends differ, and tire pressure falls with temperature. Heavy air conditioning use, short trips, towing, and a loaded roof rack all push consumption up. The fairest comparison sets a tank against earlier tanks driven in much the same way.
A notes column makes that possible. A few words beside each entry, such as mostly highway, cold week, road trip with four passengers, or new tires, explain later why a number looks high or low. Looking at an average across several consecutive tanks also smooths out the small differences in where individual pumps shut off. Once the log covers a full year, comparing this winter with last winter, or this summer's vacation drive with the previous one, says far more than comparing January with July.
Spot changes
After several fill-ups, a baseline appears: the range of results the car normally returns for a given kind of driving. One low tank inside that range is ordinary variation and rarely means anything. What deserves attention is a sustained slide, where three or four tanks in a row come in below the usual figure even though the routes, weather, and load have stayed about the same. A sudden sharp drop that the notes cannot explain is also worth a closer look.
Many causes are mundane. Underinflated tires, a recently fitted set of different tires, a cargo box left on the roof, or a change in commute can each account for a decline. Mechanical causes are possible too, including a dragging brake, an overdue air filter, or an engine management fault. If a check engine light comes on around the same time, a stored fault code is evidence to interpret alongside the log, not proof that a particular part has failed, and manufacturer-specific codes need confirmation for the exact vehicle.
Everyday Use and Observations
The best log is the one that actually gets filled in. A small notebook in the glovebox works, as does a spreadsheet or notes file on a phone, or simply a photo of the pump display and the odometer taken before driving away, to be written up later. Adding the price paid lets the same record show cost per mile, which is often more meaningful for a household budget than miles per gallon alone, especially when fuel prices swing between fill-ups.
Many cars show an average fuel economy figure on the dash, and it is worth writing that number down beside the hand calculation. The two often disagree slightly, because the trip computer estimates fuel use while the log measures what actually went into the tank. A steady gap is normal; a gap that grows is worth noting. Everyday observations belong in the log too, such as a rough idle, a fuel smell, a hard start, or a tire that keeps losing air.
Limits and Next Steps
A fill-up log shows that consumption changed, not why. It also inherits small errors from its inputs. Pumps shut off at slightly different points, parking on a slope can alter how full the tank gets, and an odometer may read differently when tires of a non-original size are fitted. Individual tanks should therefore be treated as rough readings and trends as the real signal. Figures from one car also cannot be judged against another owner's results, since engines, gearing, tires, and driving routes vary widely.
When a decline persists, begin with simple checks: set tire pressures to the values on the vehicle's door-jamb placard, remove unused racks and heavy cargo, and review the maintenance schedule in the owner's manual. If the numbers stay low, or if a warning light, fuel odor, or visible leak appears, have a qualified technician inspect the car, and treat any suspected fuel leak as a reason to stop driving it. Bringing the log along gives the shop dates, mileage, and conditions to work from.