How Does a Car Display Recovered Energy? Power Meter, Trip Data and Meaning
Most electrified vehicles, from mild hybrids to battery-electric cars, can turn some of their motion back into stored electricity when slowing down. Because this process is silent and invisible, manufacturers rely on the instrument cluster and infotainment screens to show it. This guide explains how a car displays recovered energy through its power meter and trip statistics, and how to read those numbers without overestimating what they mean.
Power meter
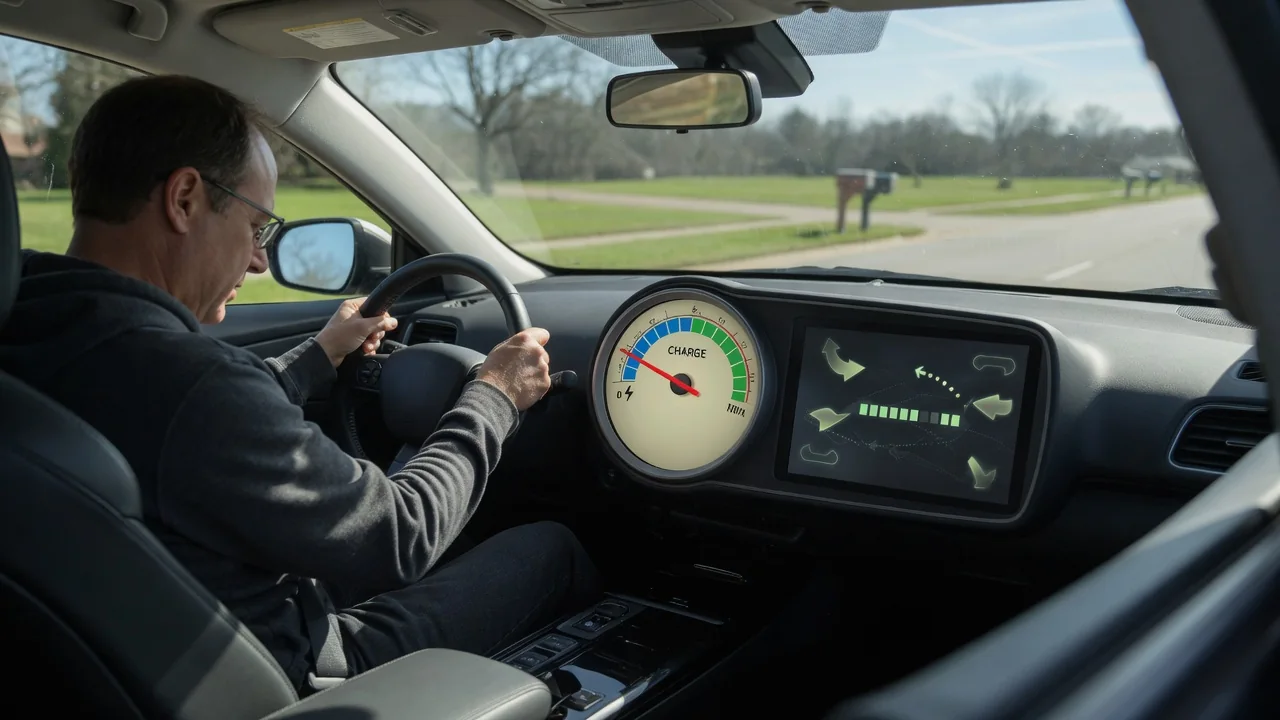
The most immediate EV energy recovery display is the power meter, sometimes called a power gauge, hybrid system indicator or energy flow meter. It often replaces or sits beside the tachometer and shows, in real time, whether the electric drive system is drawing energy from the battery or sending it back. Discharge is usually shown on one side of a zero point, and charging, which includes regenerative braking, on the other. The charge zone is often colored differently, commonly green or blue, so the driver can see at a glance when the motor is acting as a generator.
Scales vary. Some vehicles label the meter in kilowatts, which gives an actual instantaneous power figure for both acceleration and recovery. Others use unitless segments, a sweeping needle or a moving bar whose length only suggests relative intensity. In many hybrids, a separate energy flow screen adds animated arrows between engine, motor, battery and wheels, showing the direction energy travels at that moment. These are schematic representations rather than precise measurements, and their exact behavior differs between manufacturers.
Some designs also indicate how much regeneration is currently available. When the battery is nearly full or very cold, the charge portion of the gauge may be shortened, dimmed or marked as limited, signaling that the car may rely more on its friction brakes. Whether and how a given vehicle shows this is described in its owner's manual.
Trip statistics
While the power meter shows a single moment, trip statistics summarize recovery over time. Depending on the vehicle, the trip computer or energy screen may report total energy used, energy recovered, average consumption and sometimes a breakdown of where energy went, such as driving, climate control and accessories. Recovered energy is commonly shown in kilowatt-hours, as a percentage of energy consumed, or as an estimate of distance added to the remaining range.
These figures are tied to a reset point. Many cars keep separate counters for the current trip, the period since the last charge and the period since a manual reset, and some display short history charts by distance or time. Hybrid vehicles may instead show an eco score or the share of distance driven with the engine off, which reflects regeneration indirectly rather than reporting it as a separate quantity.
The calculation behind each figure is not standardized across the industry. One system may count the electrical energy measured flowing into the battery during deceleration, while another may estimate range added using a recent consumption average. Because of this, numbers from different cars, or even from different screens in the same car, are not directly comparable.
Interpretation
Reading recovered energy correctly starts with understanding what it represents. Regenerative braking does not create new energy; it captures part of the kinetic and potential energy the car already gained from its battery or fuel. A high recovery figure therefore often reflects a route with many stops, long descents or heavy traffic, not necessarily efficient driving. A trip on a flat, steady highway may show little recovery yet still have lower overall consumption.
Conversion losses also matter. Energy moves from the wheels through the motor, inverter and battery, and later back again, and each conversion loses some of it. A displayed recovered figure is generally the energy that arrived at, or was attributed to, the battery, not the amount that will eventually reach the wheels. Avoiding unnecessary braking, or coasting where conditions allow, can therefore use energy more effectively than slowing down and recovering it.
The most useful number is usually net consumption, such as kilowatt-hours per 100 miles, miles per kilowatt-hour or fuel economy, because it already includes the benefit of regeneration. Recovered energy is best treated as context that explains why consumption looked the way it did, and the power meter as a real-time aid for smooth, anticipatory deceleration.
Practical implications and limits
In everyday use, these displays help drivers build habits: easing off the accelerator earlier, braking gently so the system can stay within its regenerative capacity, and choosing a regeneration level or one-pedal mode that suits traffic, where the vehicle offers one. Watching the charge zone during a gradual stop gives a sense of how firm deceleration can be, although most cars blend regenerative and friction braking without showing exactly where that transition occurs.
Several conditions reduce what the displays can show. A battery near full charge, low battery temperature, slippery road surfaces and stability or traction control interventions can all limit regeneration, so lower figures in cold weather or right after charging are expected rather than a sign of a fault. Rounding, slow update rates and averaging can also make short trips look inconsistent.
Finally, these screens are driver information, not diagnostic instruments. They are not designed to verify battery health, measure brake wear or audit efficiency to a laboratory standard. If regeneration appears permanently unavailable or a warning light accompanies the gauge, the owner's manual and a qualified service provider are the appropriate references, rather than conclusions drawn from trip statistics alone.