How Do Engineers Visualize Airflow Around a Car?
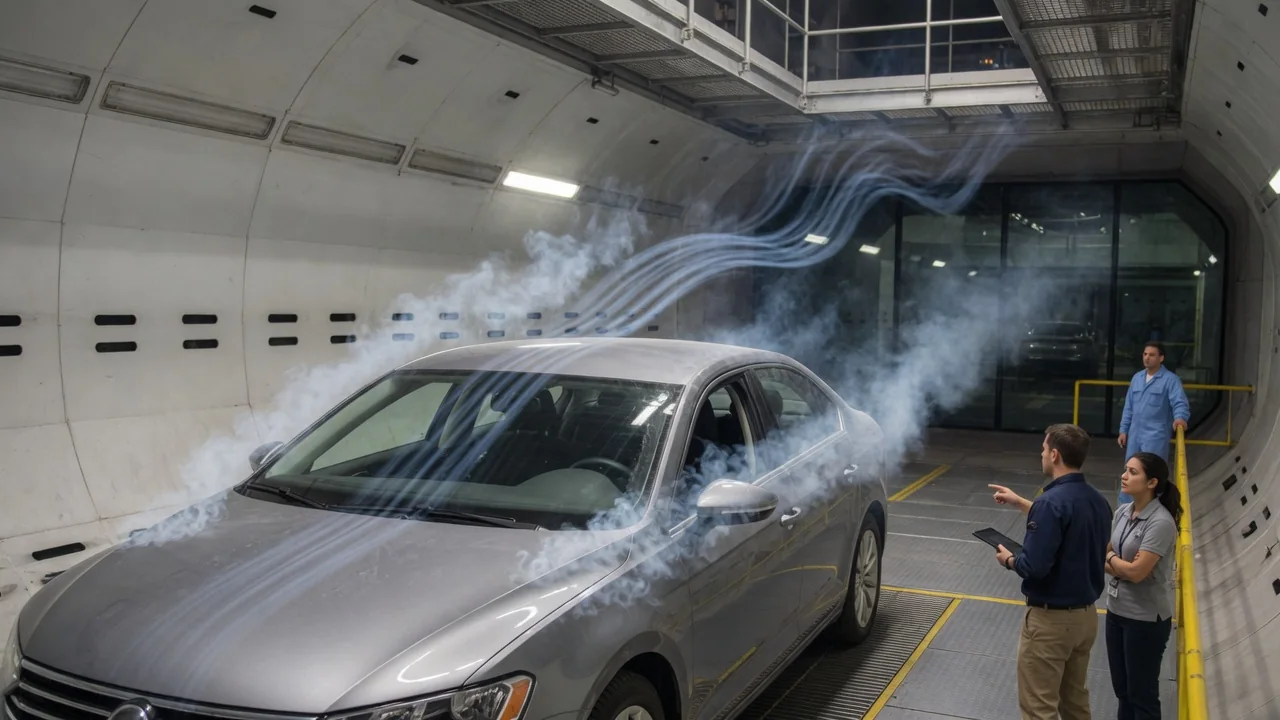
Air is invisible, so engineers who shape a car's body need ways to make its movement visible and measurable. How do engineers visualize airflow around a car? They combine direct visualization, such as smoke streams and yarn tufts, with pressure measurements across the body surface. They then interpret the results alongside force data and computer simulation. Each car airflow visualization method answers a different question, and none tells the complete story on its own.
Smoke and tufts
In a wind tunnel, engineers often release thin streams of smoke upstream of the vehicle, from a handheld wand or a rake of nozzles arranged side by side. Because the air carries the smoke, each stream traces the path the air takes over the nose, hood, windshield, roof and rear. Where the flow stays attached, the smoke follows the body contour in smooth, orderly lines. Where the flow separates, the streams break apart, curl back and spread into a turbulent wake. Smoke is especially helpful for seeing how air leaves the rear of the body and where it rolls up into vortices around mirrors and pillars. It works best at relatively low air speeds, because faster flow mixes the smoke quickly and blurs the pattern.
Tufts are short pieces of yarn or wool taped by one end to the body panels, usually in a grid. Each tuft acts like a tiny wind vane showing the local flow direction at the surface. A tuft that lies flat and points steadily downstream indicates attached flow. One that flutters, lifts or points forward suggests separated, unsteady or reversed flow. Tufts give a quick overview of a whole panel. Unlike smoke, they work on the road as well as in a tunnel, filmed by cameras on the car or on a chase vehicle. Their limitation is that they show only surface behavior. The tufts and tape also slightly disturb the thin layer of air they are meant to reveal.
Pressure mapping
Visual methods show where air goes, but pressure determines the forces it applies. Drag and lift come largely from pressure differences acting over the body. To measure them, engineers fit small holes called pressure taps flush with the skin of a model or vehicle. Tubing connects the taps to transducers or multichannel scanners that sample many points quickly. Readings are usually expressed as a pressure coefficient. This is a dimensionless value that compares local pressure with the pressure of the undisturbed oncoming air, scaled by the air's dynamic pressure, so results stay comparable across test speeds. Engineers can plot the values as a color contour map over the body or as a graph along a line, such as the centerline from nose to tail.
The general pattern on a road vehicle is well understood, though its details depend on each shape. Pressure is high where oncoming air is brought nearly to rest, such as at the nose and near the base of the windshield. It drops where air speeds up around curves, such as the leading edge of the hood and the front of the roof. The region directly behind the car is usually left at low pressure, which pulls rearward on the body and adds substantially to drag. Pressure under the car influences lift. In research settings, pressure-sensitive paint can turn discrete points into a continuous map, because its glow changes with pressure. It requires controlled lighting and calibration.
Computational fluid dynamics, or CFD, produces the same kinds of images digitally: surface pressure maps, simulated streamlines and slices through the wake. It can show flow in places that are hard to fit with instruments, such as inside wheel wells or around underbody components. It remains a numerical model. Its accuracy depends on its mesh, turbulence modeling and boundary conditions, so engineers check it against physical measurements rather than treating it as a replacement.
Interpretation
Collecting images and numbers is only the first step. The value lies in reading them. Engineers look for where the flow separates, how large the separated region becomes, whether the flow reattaches downstream, and how the wake is shaped. As a general principle, flow that leaves the body at a defined edge tends to produce a more predictable wake than flow that separates at a shifting point on a smooth curve. Vortices are another focus. Air rolling off pillars, mirrors or rear corners can affect drag, wind noise, dirt buildup on rear surfaces and the car's response to crosswinds. Spotting where these vortices begin tells engineers which part of the shape to change.
Engineers do not rely on any single method. Tufts may look calm while pressure data show rising pressure that warns of separation just ahead. Smoke may reveal a wake's shape without showing how much low pressure it carries. Engineers therefore read visualization alongside force-balance measurements of total drag and lift. A tidier-looking pattern does not automatically mean lower drag, and one change can move drag and lift in different directions. Interpretation is usually comparative. Engineers test a baseline, change one element such as a spoiler, mirror housing or underbody panel, and see how the patterns and forces respond. Real flow is also unsteady, so a time-averaged pressure map and a single video frame can tell slightly different stories.
Practical implications and limits
Every test environment simplifies reality. A wind tunnel offers controlled, repeatable air. On the road, however, the ground moves relative to the car, while a tunnel floor stays fixed. That is why some facilities use moving belts and rotating wheels to represent underbody flow more faithfully. Gusts, crosswinds, traffic and road spray are hard to reproduce. Scale models add another limit. Because of Reynolds number effects, flow can separate at different positions on a model than on the full-size car. Road tests add realism but give less control, and simulations rely on assumptions. Engineers treat each source as partial evidence and gain confidence when several agree.
For car owners, the main lesson is that visualization results belong to one specific shape. General mechanisms, such as low pressure behind a blunt rear or vortices at sharp corners, apply broadly. How strongly they act on a given vehicle depends on its design. A roof rack, cargo box, aftermarket spoiler or body kit changes the airflow the manufacturer developed. Its effect on drag, noise or stability cannot be judged from appearance alone. Some enthusiasts tape tufts to their own cars and film them while driving. That can show whether air stays attached on a panel, but it cannot quantify drag or downforce. It should be done only with securely fixed tufts, a camera that does not distract the driver and full attention to traffic and safety.