EV Battery Degradation: Rates, Curves and Capacity Estimates
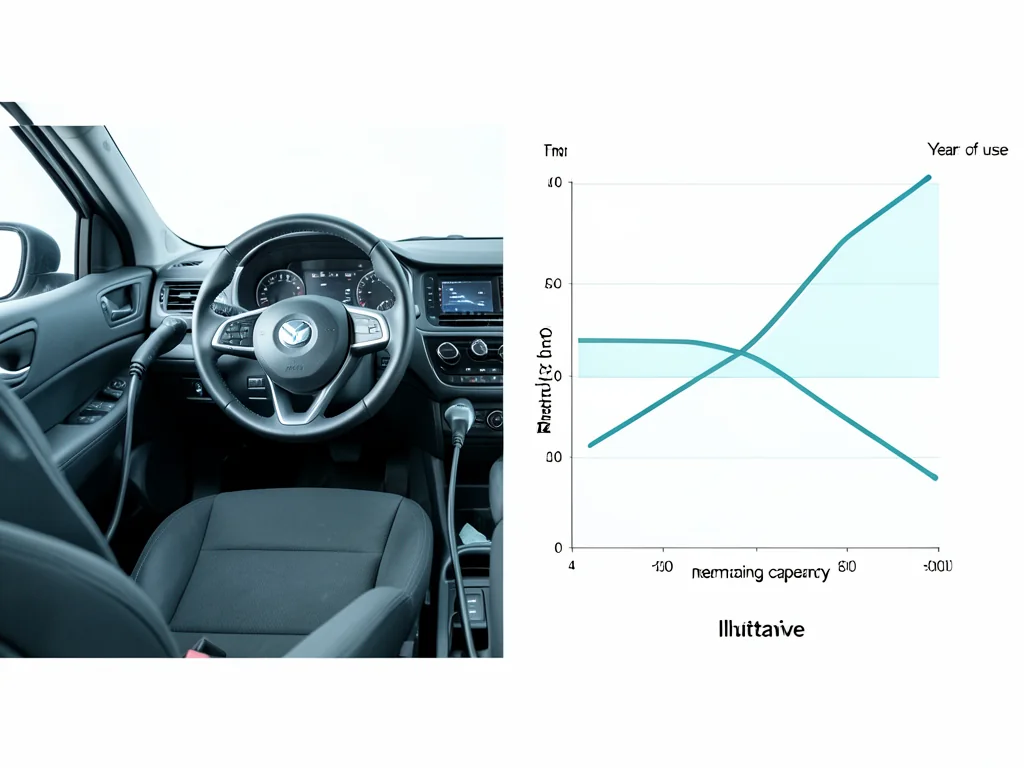
EV battery degradation refers to the gradual loss of a battery's ability to store energy, driven by chemical and physical changes during aging and use. For many drivers, this means a slow reduction in usable battery capacity and available driving range. Understanding typical degradation rates, reading degradation curves, accounting for charge cycles, and using a battery degradation calculator can help owners estimate remaining capacity and plan for long-term ownership.
What EV Battery Degradation Means
An EV battery degrades because its internal chemistry changes over time. Repeated charging and discharging causes microscopic wear on electrodes and electrolyte, while passive chemical reactions continue even when the vehicle is parked. Capacity loss is usually expressed as a percentage of a stated starting capacity, often the manufacturer's rated usable capacity when new. That baseline matters because different EVs have different initial buffers and usable energy, so the same percentage loss can mean different amounts of lost range.
Permanent capacity loss directly reduces the energy available for propulsion, which tends to lower real-world driving range under identical conditions. However, the dashboard range estimate is not a direct capacity measurement because it responds to temperature, driving style, and recent energy consumption. A drop in displayed range may reflect efficiency changes rather than battery degradation alone. Degradation also does not by itself indicate imminent failure or a required replacement; many vehicles continue operating safely with meaningful capacity loss.
Why Capacity Changes With Time and Use
Calendar aging occurs as a function of time and storage conditions, even when the vehicle is not driven. Chemical side reactions slowly consume active lithium and increase internal resistance. Higher ambient temperatures and prolonged resting at a high state of charge accelerate these reactions. Cycle aging, by contrast, is wear associated with moving energy into and out of the battery. Each charging and discharging event stresses the materials, and the cumulative energy throughput contributes to gradual capacity loss.
Battery temperature, time spent at high states of charge, and charging conditions all influence the rate of aging. Frequent DC fast charging can generate heat and stress the pack, while moderate AC charging at lower states of charge is generally gentler. Battery chemistry, pack design, and thermal management systems further modulate these effects. Liquid cooling or heating keeps cells within a preferred temperature range, reducing stress. Because these factors differ among models and climates, no single degradation prediction fits every EV.
How to Interpret an Annual Degradation Rate
An annual degradation rate describes how much capacity is lost per year, but it must specify the reference base. It is usually expressed as a percentage of original capacity, though some reports state loss relative to the current remaining capacity. A rate of 1% per year relative to original capacity means the battery retains 99% of its starting energy after one year. If expressed relative to remaining capacity, the same absolute loss can appear as a slightly higher percentage.
A reported average annual rate depends on the vehicles, ages, climates, usage patterns, and observation period included in the data. Fleets in moderate climates with careful charging may show slower loss than vehicles frequently fast-charged in hot regions. Typical rates observed in early EV studies should not be treated as universal or guaranteed. Extending a rate measured over three years to a fifteen-year life assumes linear behavior, but aging often changes pace over time.
Reading Battery Degradation Charts and Curves
Degradation charts typically plot remaining capacity or capacity loss on the vertical axis against years, mileage, or accumulated equivalent full cycles on the horizontal axis. Many curves show a relatively steep initial decline during the first year or two, followed by a long period of gradual loss. Some data suggest possible later acceleration due to chemical exhaustion, but that shape is not inevitable. Individual vehicles can deviate substantially from the average curve depending on climate and charging habits.
A well-designed chart should label its axes, units, and the population represented. Averages smooth over important variation, while individual observations or uncertainty bands reveal the spread in outcomes. A chart based on a specific model and region cannot predict an individual vehicle's future capacity with certainty. It offers context about what other similar vehicles have experienced, but the owner's own usage, temperature exposure, and charging practices remain the strongest local predictors.
What Counts as an EV Battery Charge Cycle
An equivalent full cycle is a standard accounting unit for battery energy throughput. It corresponds to the cumulative amount of energy equal to one complete discharge of the battery's usable capacity, regardless of how that energy is moved. For example, driving from 80% to 30% uses 50% of the capacity; doing that twice, plus one full 100% to 0% discharge, totals two equivalent full cycles even though many separate events were involved.
Plugging in once does not necessarily represent one full cycle. A short 10% top-up after a commute contributes only a tenth of a cycle. Conversely, a long road trip with multiple charging stops could add more than one equivalent full cycle in a day. Cycle counts alone cannot determine remaining capacity because calendar aging, temperature, and average state of charge also affect degradation. A vehicle with many gentle partial cycles may retain more capacity than one with fewer but harsher full cycles.
Estimating Remaining Capacity With a Calculator
A battery degradation calculator typically asks for starting usable capacity, elapsed time, and an assumed annual degradation rate. Some tools also request average annual mileage or charging habits to refine the estimate. A basic linear model computes remaining capacity as starting capacity multiplied by one minus the assumed cumulative fractional loss. For example, a 75 kWh pack with a 2% annual loss is estimated to retain 75 × (1 − 0.02 × 5) = 67.5 kWh after five years. This assumes linear aging and a constant rate, which is a simplification.
The mathematical structure of the calculator shapes its output. A linear model subtracts the same amount each year, while a compounded model applies the rate to the current remaining capacity, producing a slightly slower absolute decline. A nonlinear model may include an initial faster loss followed by flattening. Entering an assumption does not validate it; the result is only as sound as the assumed rate. Calculator outputs are planning estimates with uncertainty. They do not replace qualified assessment of an individual battery's health or fault codes.